Research
Studies
Ask what stocks looked like before and after historical market events.
A Study examines every occasion in history when a set of conditions first held for a stock — for example, its 12-month return crossed +100% — and measures what stocks looked like before, on and after those events. It is research into historical association, not a screen of today's market and not a trading backtest.
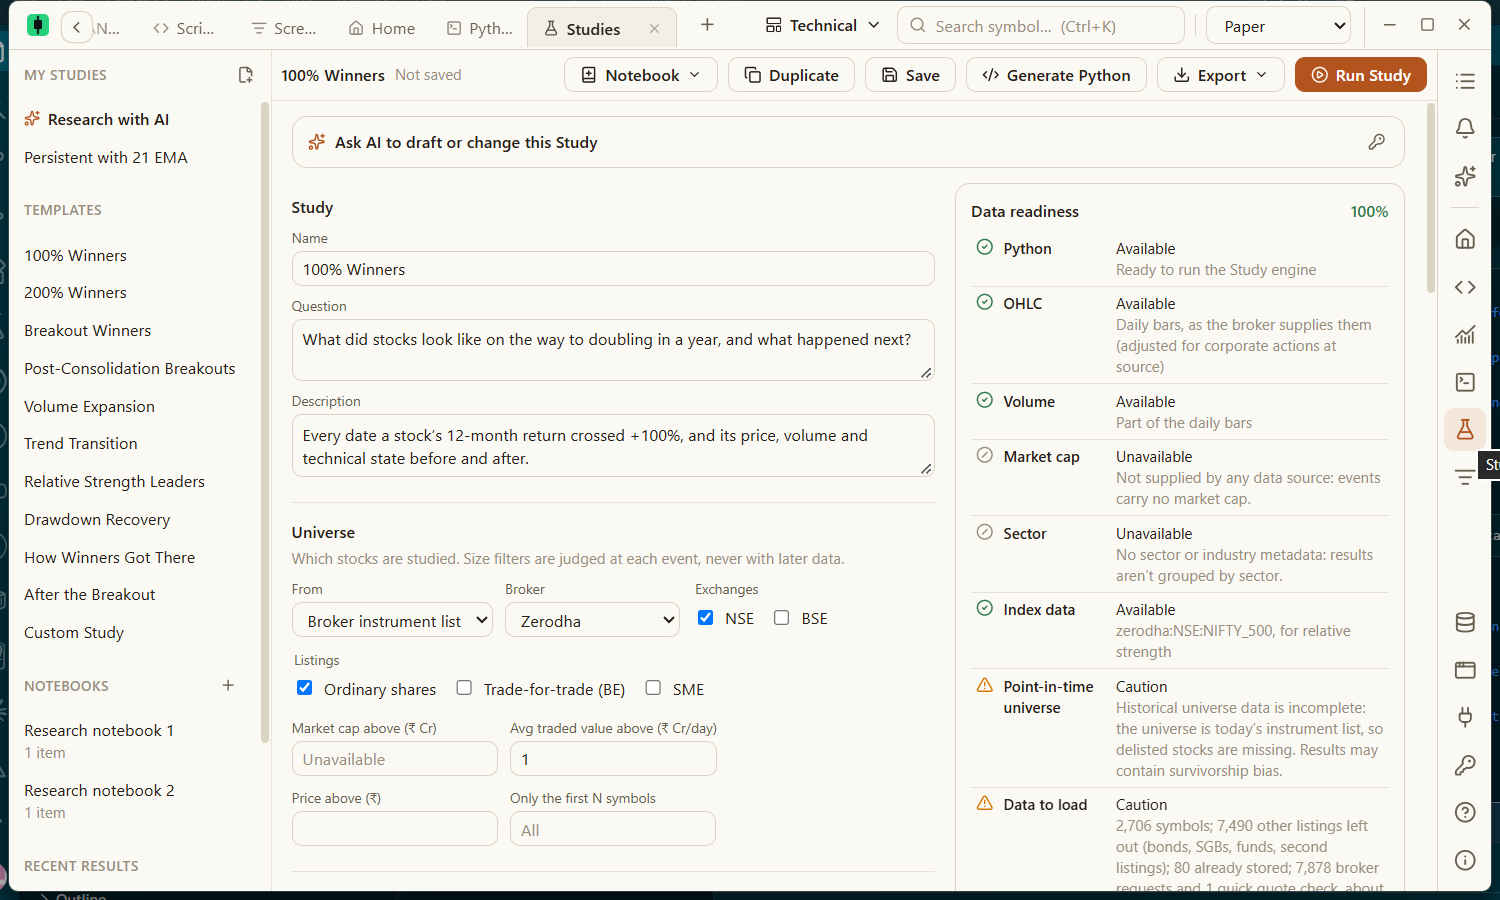
Starting a Study
Pick a template on the left — 100% Winners, Breakout Winners, Volume Expansion, Relative Strength Leaders, Drawdown Recovery and more — or New Study for a blank one. Any Study can be edited, duplicated and saved under My Studies.
The builder
| Section | What you set |
|---|---|
| Study | A name, the question the Study answers and a description. |
| Universe | A broker's NSE/BSE list, a watchlist or listed symbols; optional floors on traded value and price. |
| Study period | The dates within which events are looked for. |
| Event | Conditions that must all hold together, and a cooldown so one move counts as one event. |
| What to measure | Measures over a window of bars around each event: return, drawdown, how often a condition held… |
| Event-day snapshot | Conditions before the event, observation points, forward windows and yes/no characteristics. |
| Comparison | A control group of random dates, or an outcome that splits events into those that went on to a gain and those that did not. |
Data readiness
- The panel on the right shows what data is available and how many stocks will be loaded.
- Market cap, sectors and historical index membership are not available from these data sources.
- Results carry a survivorship-bias warning: today's instrument list excludes companies delisted in the past.
- With Keep the market loaded on, a Study reads NSE history from memory in batches instead of asking the broker. Anything it does not hold (BSE listings, history older than five years) is fetched at the broker's rate limit and held until the app closes, so reruns that day take seconds.
Running
Press Run Study. A progress bar shows each stage; Stop cancels. When the run finishes its result opens automatically. Nothing runs until you press Run Study.
Reading results
| Part | What it shows |
|---|---|
| Question and answer | The Study's question and an answer written from the numbers: what each headline measure came to for the typical stock, and how it compares with the comparison group. |
| Chart | How a measure is spread across the stocks. |
| Stock by stock | Every event with its measures. Click a row to open the chart framed around the event. Add to a watchlist adds every stock. |
| Details | Fuller tables: measures, event timeline, distributions, results by liquidity, the comparison and a stock explorer. |
Compare, keep notes, export
- Every run is stored under Recent results (the last 20 of each Study).
- To compare two runs, press the compare icon on one and then another.
- Research Notebooks group Studies and results with your own notes.
- Export saves the specification, a Python version, CSV tables, the full result as JSON or a written report. Generate Python shows the Study as a script you can run in the Python tab.
AI in Studies
Describe a Study in plain words above the builder and the assistant drafts it for you to review. Explain with AI writes a plain-language reading of a result using only summary figures, never individual events or prices. Research with AI plans up to four Studies for a broad question, which you approve and run. These use your own AI key and are billed to your account — see AI providers.