Research
Python scripts
Screen, backtest and analyse your broker's data with your own Python code.
Setting up
- Install Python 3.10 or newer on your computer if you do not have it.
- Open the Python tab with
Ctrl+Shift+Yor the Python icon. - Press Set up Python. The app creates a private environment in its data folder and installs pandas and numpy into it.
To use an environment of your own (conda, uv…), open the gear icon (Python settings) and choose its interpreter. The settings also show how much market data the app holds in memory for scripts, the Screener and Studies, and Clear it empties it now.
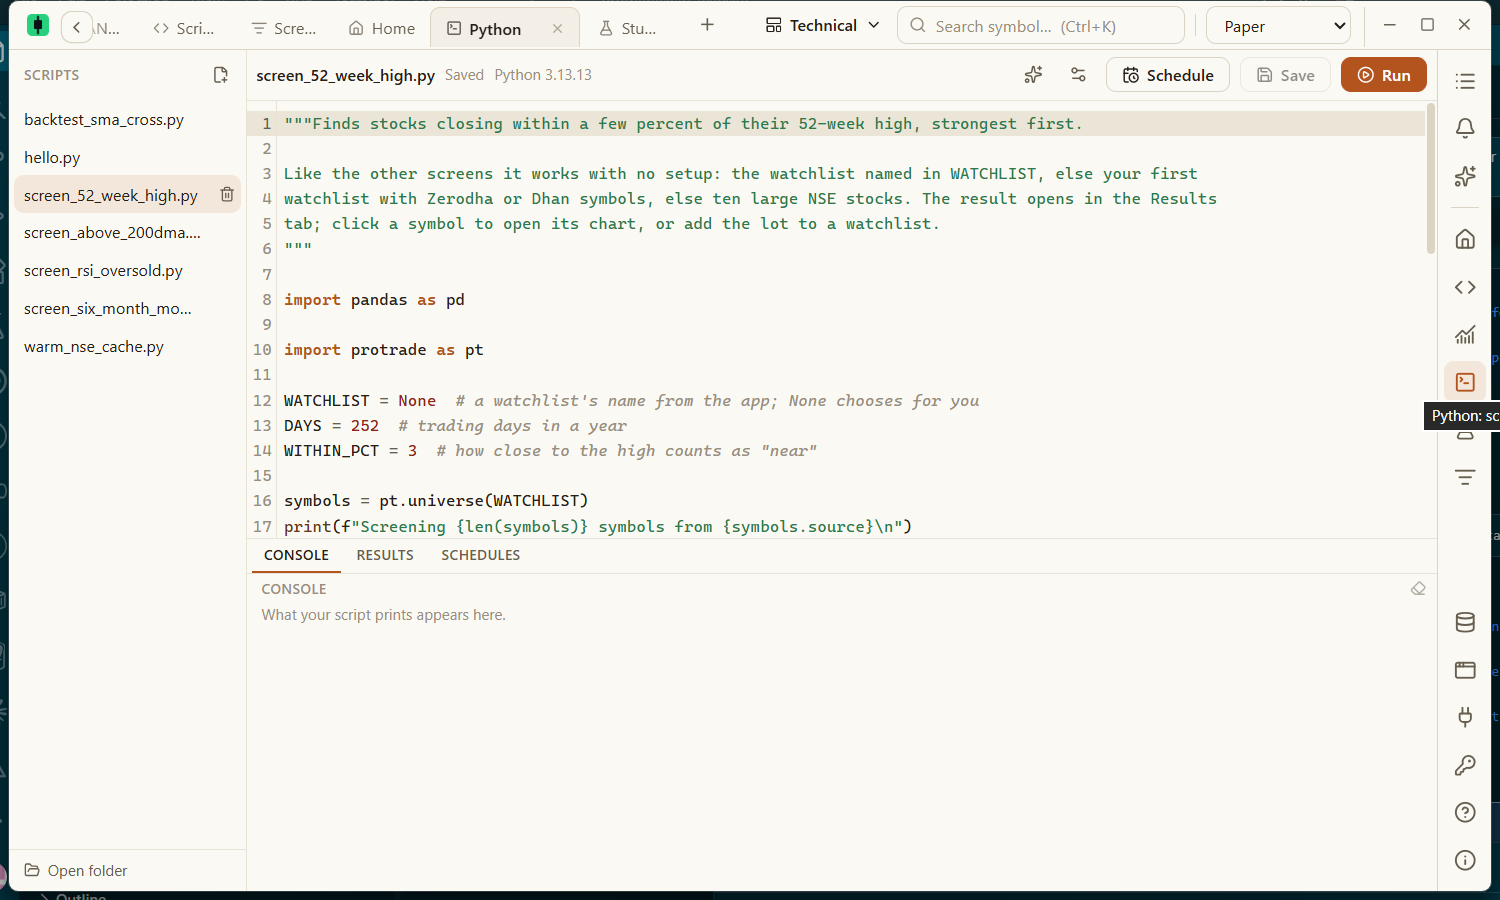
The workspace
| Part | Purpose |
|---|---|
| Scripts (left) | Your scripts, stored as ordinary .py files. + creates one; Open folder shows them on disk. |
| Editor (centre) | Edit the open script. Ctrl+S saves; Ctrl+Enter runs. |
| Run / Stop | Runs the script; Stop ends it. |
| Console | Everything the script prints, with errors highlighted. |
| Results | Tables, backtest reports and figures the script shows. |
| Schedules | Runs scripts automatically at set times. See Scheduled scripts. |
Example scripts are included to start from: a greeting, four screens (above the 200-day average, RSI oversold, 52-week highs, six-month momentum) and a moving-average crossover backtest.
The protrade package
Scripts reach market data through the protrade package, which the app provides automatically:
import protrade as pt

df = pt.bars("zerodha:NSE:RELIANCE", "D", start="2024-01-01")
panel = pt.bars_many(pt.universe("Nifty 50"), "D", limit=250, errors="skip")
pt.show(table, title="Above the 200-day average")| Function | Purpose |
|---|---|
pt.bars(symbol, interval, …) | Price history for one symbol, as a pandas DataFrame. |
pt.bars_many(symbols, …) | History for many symbols at once. |
pt.panel(symbols, …) | Daily bars for many symbols in one read from what the app holds in memory. |
pt.snapshot(symbols) | Today's quote for many symbols in a few seconds: open, high, low, close, previous close, volume and when each last traded. |
pt.universe(name) / pt.watchlist(name) | The symbols of a watchlist. |
pt.show(df, title) | Shows a sortable table in Results; a symbol column is clickable. |
pt.report(trades=…, equity=…) | Shows a backtest report with return, drawdown, Sharpe ratio, win rate and an equity curve. |
pt.plot() | Shows the current matplotlib figure. |
pt.set_watchlist(name, symbols) | Creates or refreshes one of your watchlists. |
Things to know
- Scripts can read Zerodha and your imported CSV data — read only.
- Zerodha serves 1, 3, 5, 10, 15, 30 and 60 minute and daily bars. Use
pt.resamplefor others. - Speed. With Keep the market loaded on,
pt.panelandpt.bars_manyread daily bars for every NSE stock from memory in one request. Anything else is fetched from your broker at its pace (Zerodha allows about three a second) and held until the app closes. - Your credentials stay in the app. A script never receives a broker key or token.